


Quick Overview
Many insurance buyers focus only on promised returns or maturity values and overlook the fine print that explains how the policy actually works. This often leads to confusion about charges, returns, and payouts later.
At Ditto, we’ve studied IRDAI’s circulars on benefit illustrations, reviewed disclosures across major life insurers, and analyzed how these projections are presented to real customers.
This guide explains what a benefit illustration is, how to read it, and how it helps you understand charges, returns, and payouts before choosing a life insurance policy.
Note: IRDAI prescribes different benefit illustration formats for various policy types, including linked and non-linked, life and pension plans. That’s why benefit illustrations can look quite different depending on the insurance product type.
What is a Benefit Illustration?
A benefit illustration is a standardized document that a life insurance company is required to provide to you before purchasing a life insurance policy. It shows, year by year, what the projected returns, charges, and payouts from your policy might look like over the entire policy term.
Illustrations Across Plans and Profiles
Note: The figures above are extracted from the TATA AIA Smart SIP brochure, Bajaj Life Smart Wealth Goal V brochure, and HDFC Life Smart Protect Plus brochure.
What is the Purpose of a Benefit Illustration?
Key Components of a Benefit Illustration
- Premium Amount and Policy Term
The BI states your annual or monthly premium, the premium payment term (how long you pay), and the policy term (how long the policy runs).
- Assumed Rates of Return
For traditional endowment and money-back plans, IRDAI requires insurers to illustrate benefits at two fixed return scenarios: 4% per annum and 8% per annum. These are not guaranteed, and actual returns could be higher or lower as per market performance.
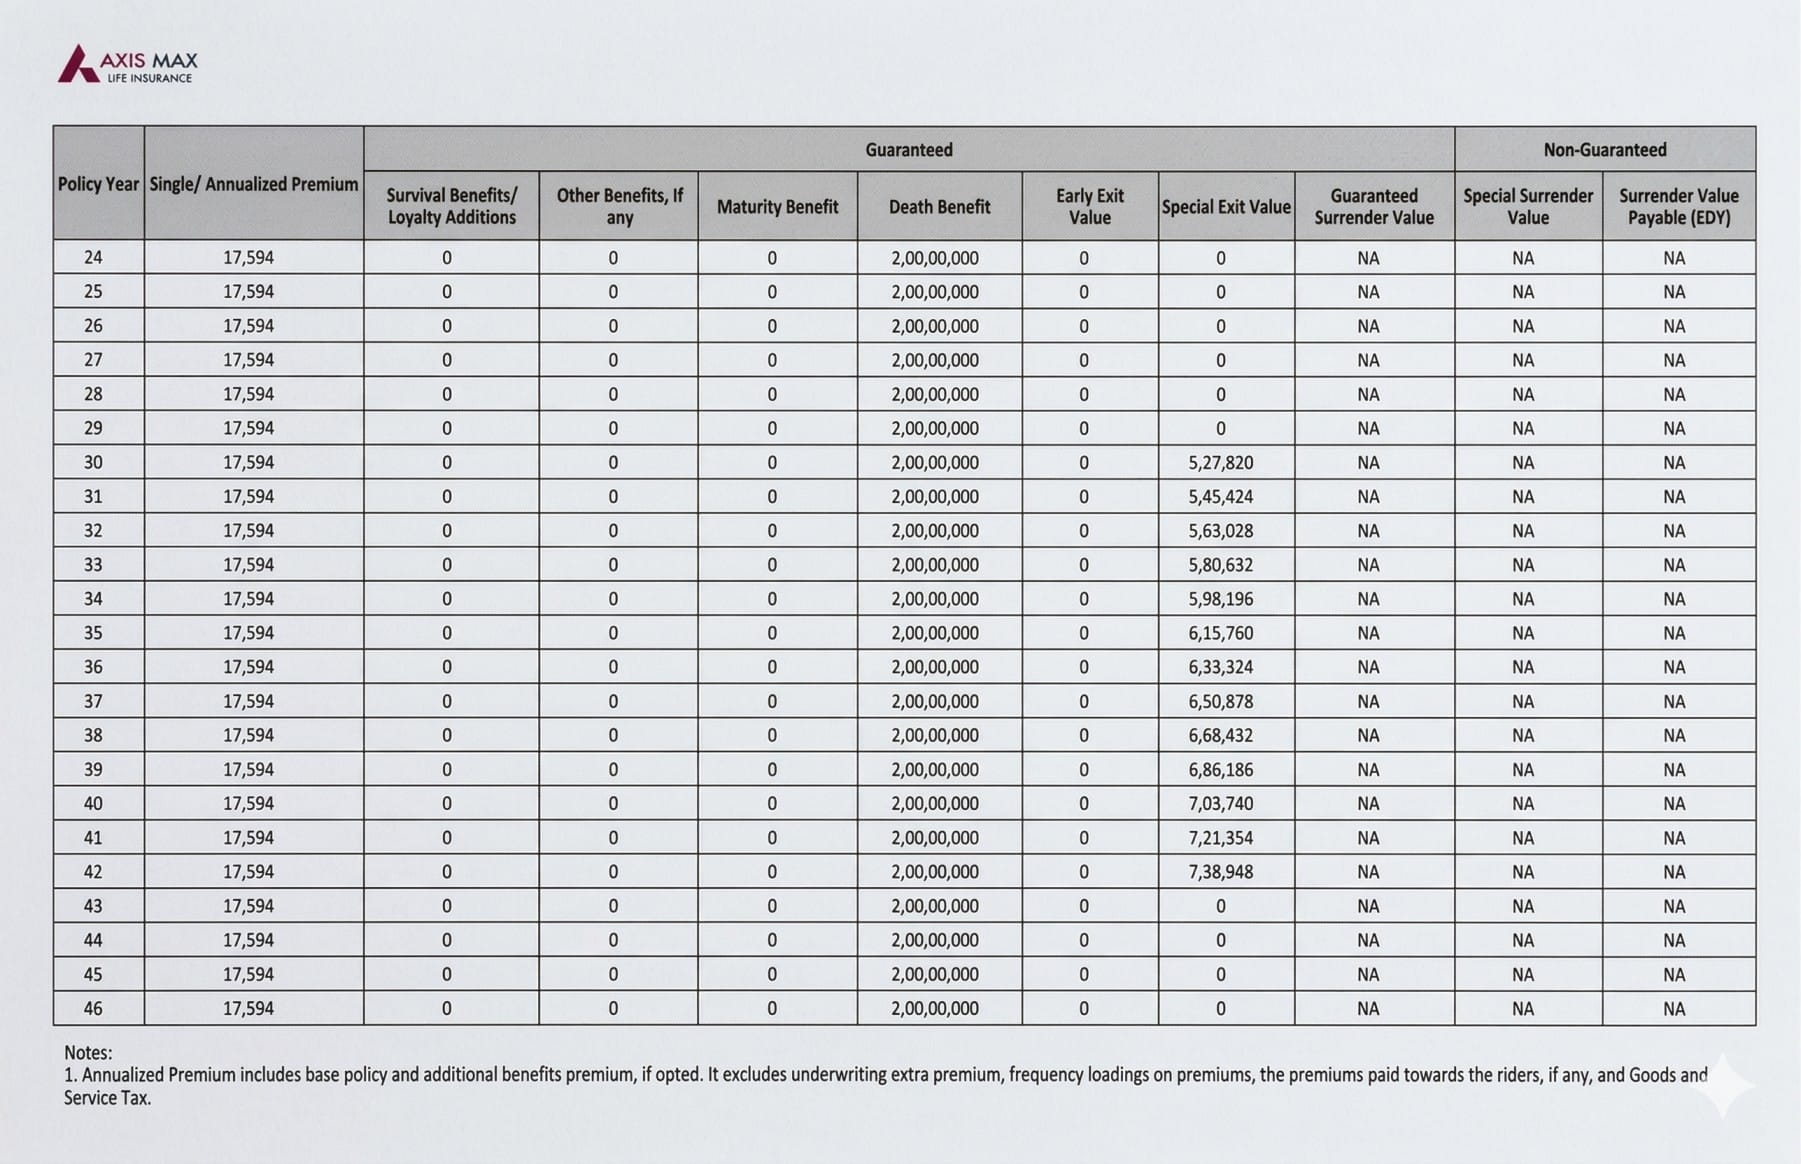
- Year-by-Year Projection Table
It shows a table running from policy year 1 to the final year, with columns covering:
- Cumulative premiums paid up to that year
- Fund value or accumulated corpus (at both return scenarios)
- Death benefit payable if you were to pass away in that year
- Surrender value if you choose to exit early
- Any bonuses declared (for participating plans)
This table lets you see exactly how your money grows (or doesn't) relative to what you put in, and at what point the policy breaks even.
- All Charges Deducted
For Unit Linked Insurance Plans (ULIPs), the benefit illustration clearly lists all charges, including premium allocation, fund management, policy administration, mortality, and surrender charges. It also shows the net amount invested after these deductions, often highlighting the gap between premiums paid and actual investment, especially in the early years.
- Net Yield
This net yield percentage indicates the effective annual return on the total premiums you pay if the policy performs as illustrated. It lets you compare a life insurance policy directly against a fixed deposit, mutual fund, or any other investment.
Note: Insurers are not required to provide benefit illustrations for certain products, such as regular premium pure term plans, regular premium pure health plans, and group term or credit life insurance policies.
Here is a benefit illustration document of Axis Max Life's Smart Term Plan Plus for a 24-year-old male, with ₹2 crore coverage till the age of 70.
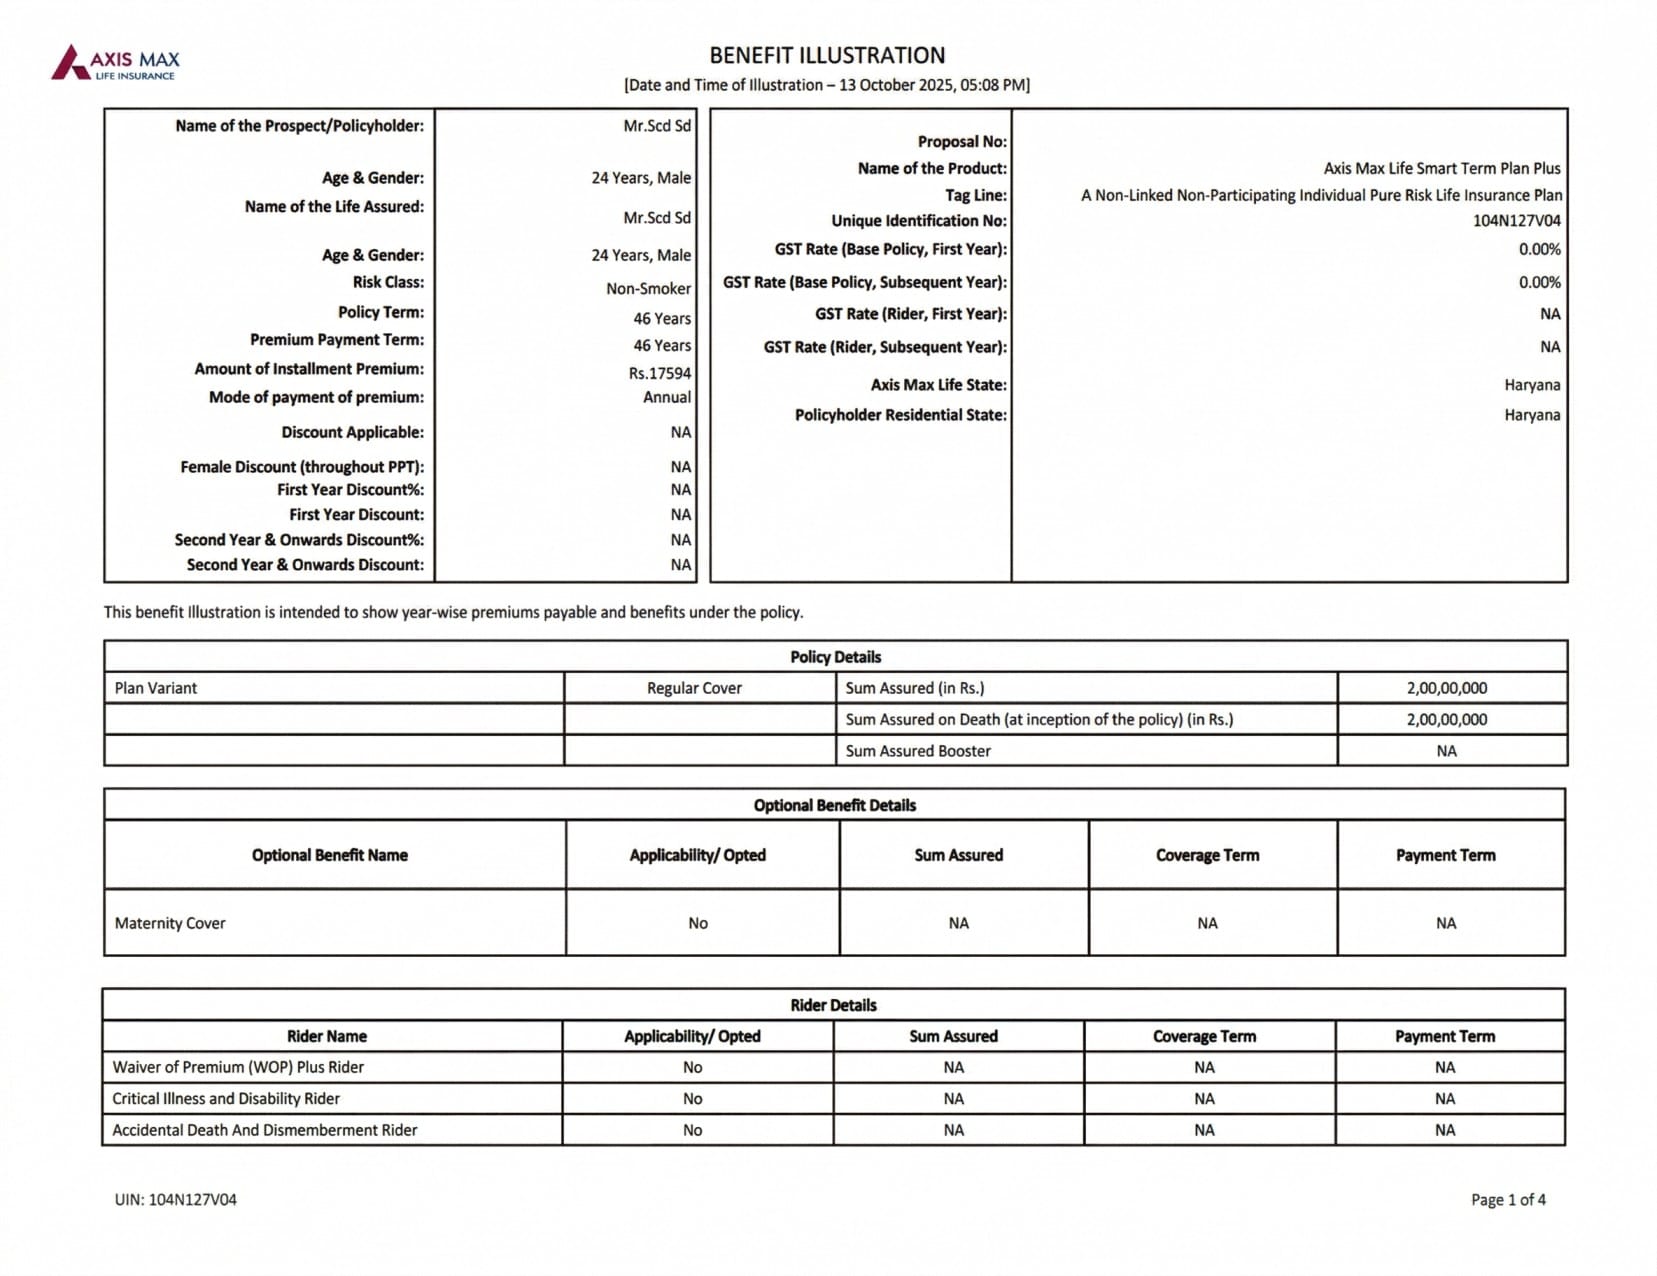
How to Read a Benefit Illustration Document?
Note: Sometimes, the illustration may not match the actual policy benefits. Always ensure the document shared is the official insurer-issued benefit illustration, not a custom version prepared by the agent.
Why Benefit Illustrations Are Important Before Buying Insurance?
- Transparency: It helps you see what benefits you might receive from the policy.
- Informed Decisions: It offers you the freedom to explore and compare different insurance plans to see which one is ideal for you.
- Manages Expectations: You can avoid future surprises by seeing both guaranteed and non-guaranteed outcomes.
Why Choose Ditto for Life Insurance?
At Ditto, we’ve assisted over 8,00,000 customers with choosing the right insurance policy. Why customers like Aaron below love us:

- No-Spam & No Salesmen
- Rated 4.9/5 on Google Reviews by 15,000+ happy customers
- Backed by Zerodha
- 100% Free Consultation
You can book a FREE consultation. Slots are running out, so make sure you book a call or chat on WhatsApp now!
Conclusion
Many people think benefit illustrations matter only for ULIPs or savings plans. In reality, they are useful even for term insurance. A benefit illustration can reveal details such as changes in premiums after the first year, rider durations, and the true value of return-of-premium or zero-cost structures.
Before buying any term insurance policy, always review the official benefit illustration carefully so you understand the charges, projections, and payouts clearly. However, these illustrations are mere estimates that do not guarantee the outcomes of how the policy will perform. It is recommended to read your benefit illustration carefully and make sure you understand all aspects.
If you are looking for a term plan, we recommend choosing from the best term insurance plans that align with your protection needs and long-term goals.
Frequently Asked Questions
Last updated on: