


What is Niva Bupa Claim Settlement Ratio?
Niva Bupa (erstwhile Max Bupa) has built a strong presence in the health insurance space since 2008. It offers everything from affordable medical policies to high-end plans with international coverage, maternity cover, and generous wellness benefits.
But when you’re choosing a health insurer, features and benefits only tell half the story. The real test begins when you or your family actually need to file a claim. That’s why understanding how an insurer performs on the Claim Settlement Ratio (CSR) becomes important.
In this article, we’ll take a closer look at how Niva Bupa fares on this crucial metric and whether its claim performance truly matches the reputation it has built over the years.
Niva Bupa Health Insurance Claim Settlement Ratio
Note: The figures are sourced from the insurer's public disclosures (Form NL 37).
Niva Bupa's Claim Settlement Ratio has been consistently rising over the past three years. This is a positive sign that the insurer is improving its claim processing efficiency and reliability.
How to Calculate a Claim Settlement Ratio?
The Claim Settlement Ratio shows how good an insurance company is at paying claims. It tells you what percentage of claims the insurer actually settles out of all the claims it receives in a financial year.
- CSR Above 90%: Generally seen as a positive sign, indicating reliable service and efficient claim processing.
- CSR Below 90%: May suggest possible inconsistencies or delays in how claims are handled.
That said, a high CSR does not guarantee approval of every individual claim. Rejections can still occur due to incomplete or incorrect documentation, non-disclosure of medical history, or exclusions mentioned in the policy. Understanding common reasons for health insurance claim rejections can help manage expectations.
Our Formula: CSR = (Total no. of claims settled ÷ Total no. of claims available to settle) × 100
Where: Total no of claims available to settle = Claims outstanding at the beginning + Claims reported during the year − Claims closed without payment − Claims outstanding at the end
It’s important to note that insurers may report CSR figures that differ from ours. At Ditto, we apply a uniform methodology across all insurers to ensure a fair comparison. This includes excluding claims closed without payment such as those rejected due to non-admissibility or lack of response from the policyholder after document requests, as including these would skew the results. We also average data over three years to provide a more accurate, outcome-focused view of how reliably an insurer settles valid claims.
Other Performance Metrics of Niva Bupa Health Insurance
While the Niva Bupa claim settlement ratio indicates claim reliability, looking at other important metrics gives a broader view of the insurer’s operational performance.
Insights:
- Average Complaints: Niva Bupa sees a three-year average of 42.85 complaints per 10,000 claims, which is on the higher side compared to some of the top insurers (like Bajaj and HDFC ERGO) that usually report below 15. While there’s been some improvement over the years, this shows there’s still room to enhance post-sale support and claim handling.
- Incurred Claim Ratio (ICR): With an average ICR of 58.40% between FY21 and FY24, Niva Bupa falls well within the healthy range of 50–80%. This means they’re paying a reasonable share of premiums as claims, while keeping the business sustainable.
- Annual Business / Gross Written Premium (GWP): Niva Bupa’s annual business, measured by Gross Written Premium (GWP), has grown steadily from ₹4,073 crores to ₹6,762 crores over the last three years. This steady rise shows that more customers are choosing Niva Bupa and that the company is expanding its presence in the health insurance market.
- Network Hospitals: Niva Bupa has a network of over 10,000 hospitals, which means customers have access to cashless treatment at a large number of hospitals across different cities and towns. Policyholders should always check the up-to-date hospital-list before undergoing treatment.
Top 10 Health Insurance Providers by Claim Settlement Ratio in 2026
To help you see how Niva Bupa Health Insurance stacks up against other leading insurers in terms of claim reliability and efficiency, here’s a list of the top 10 health insurance companies in India, ranked by their average CSR over the last three financial years:
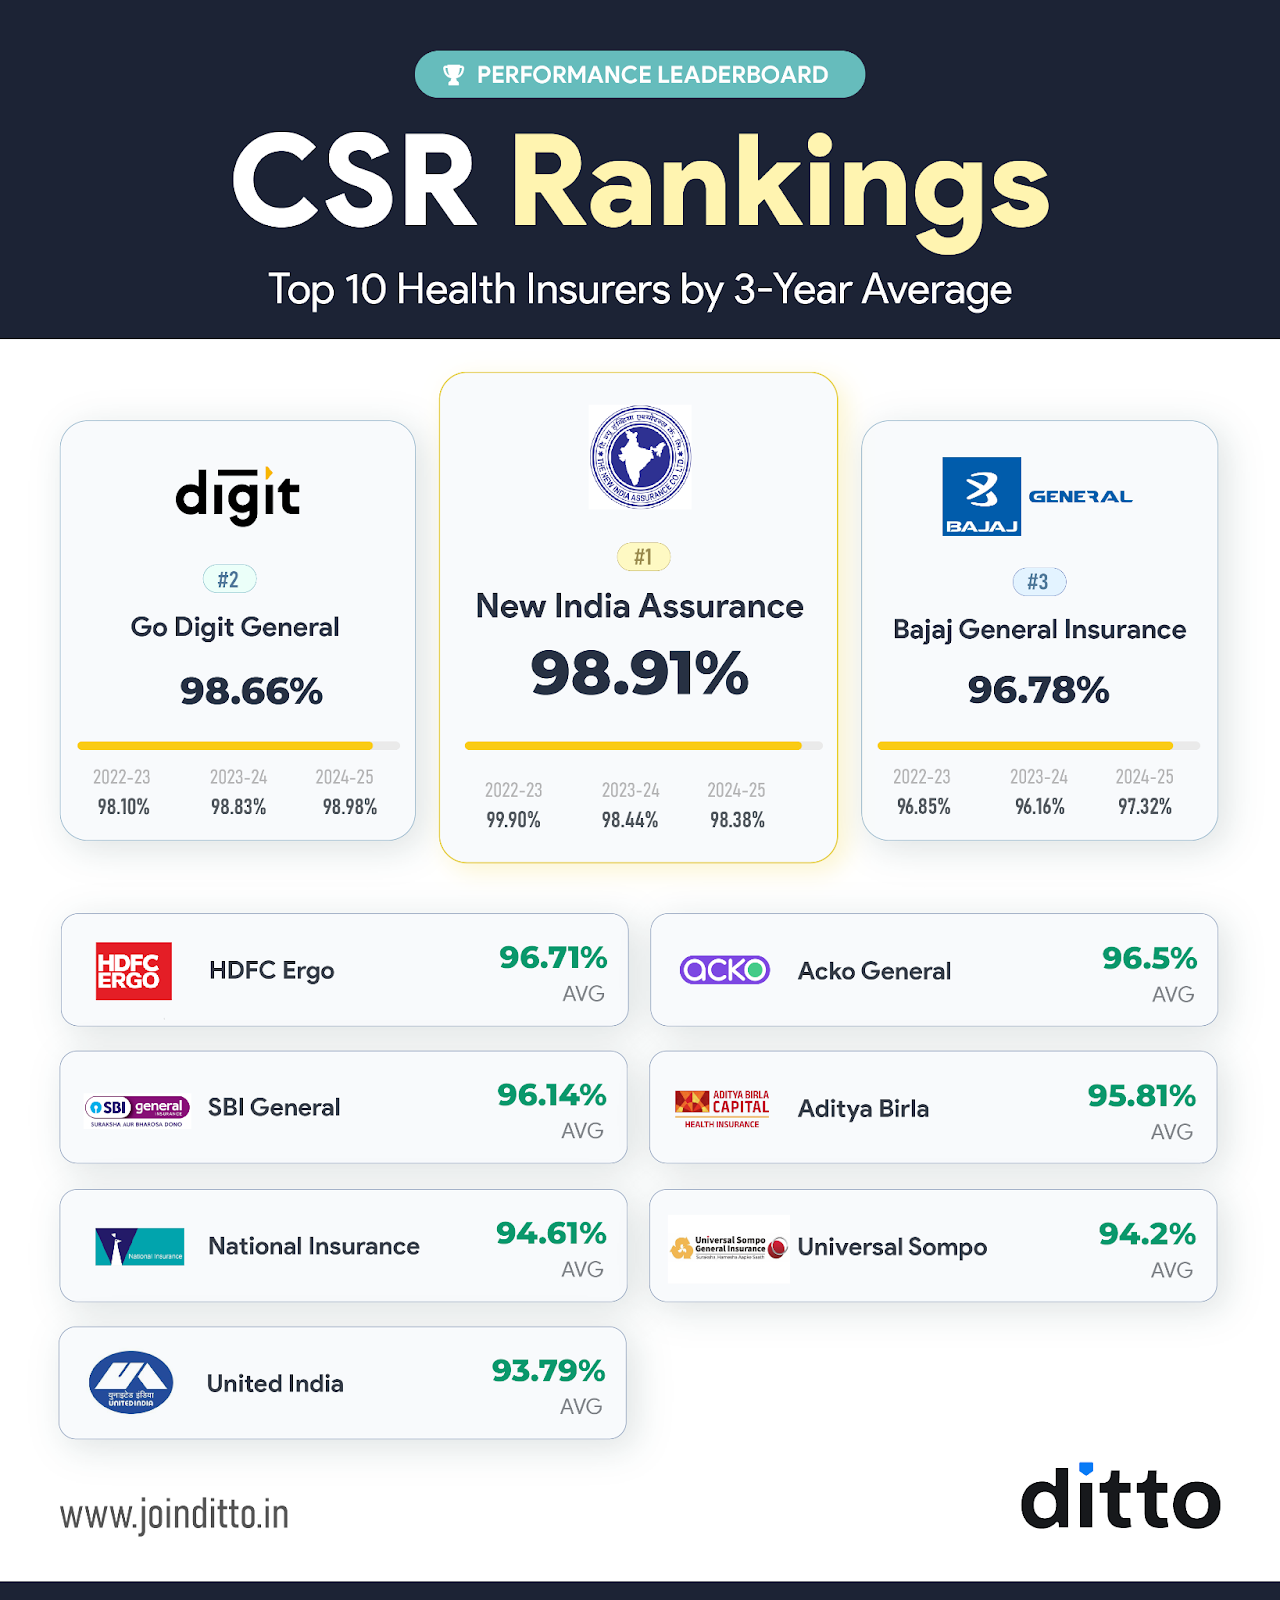
As seen in the infographic, Niva Bupa does not feature among the top 10 health insurance companies by CSR in India. This suggests there is room for improvement in its claims-handling efficiency.
Note: If you'd like to explore the detailed figures reported by insurers and the IRDAI in their annual disclosures and public reports, visit Ditto Data Labs, our proprietary repository of health insurance data, meticulously compiled, verified, and maintained by the Ditto team over the years.
Why Approach Ditto for Health Insurance?
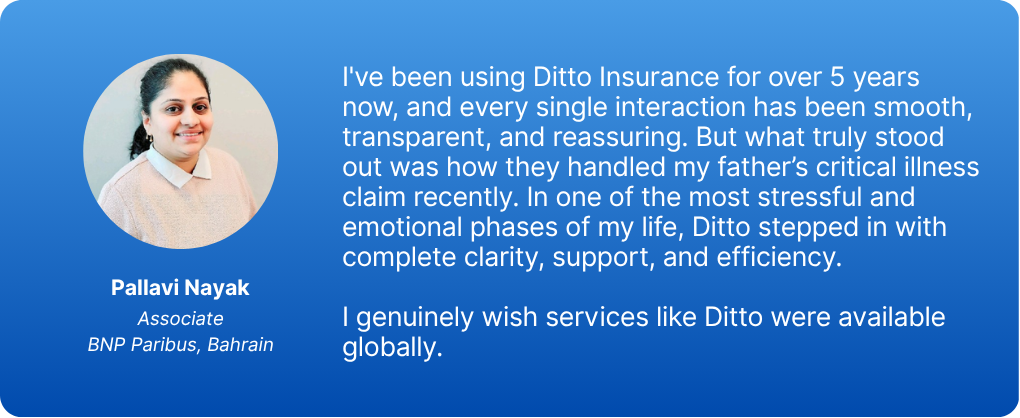
At Ditto, we’ve assisted over 8,00,000 customers with choosing the right insurance policy. Why customers like Pallavi below love us:
- No-Spam & No Salesmen
- Rated 4.9/5 on Google Reviews by 15,000+ happy customers
- Backed by Zerodha
- Dedicated Claim Support Team
- 100% Free Consultation
Confused about the right insurance? Speak to Ditto’s certified advisors for free, unbiased guidance. Book your call or chat with us on WhatsApp, slots fill up fast!
Niva Bupa CSR (Ditto’s Take)
The Niva Bupa claim settlement ratio averages around 91.62% (FY 2022–25), indicating generally reliable claims handling (but not the best). While the insurer offers competitively priced plans with some attractive features, its higher-than-average complaints volume is something policyholders should be mindful of.
Niva Bupa has a broad product portfolio and an extensive hospital network, but occasional operational inconsistencies may affect the overall claims experience. As always, it’s important to assess CSR alongside other insurer metrics, claim experience, policy benefits, pricing, and service quality before choosing a health insurance plan.
Note: Niva Bupa is a partner insurer with Ditto. All information in this article is sourced from publicly available data, including the insurer’s website and official disclosures. To understand how we evaluate insurers, check out Ditto’s Cut.
Frequently Asked Questions
Customer Reviews
Last updated on: